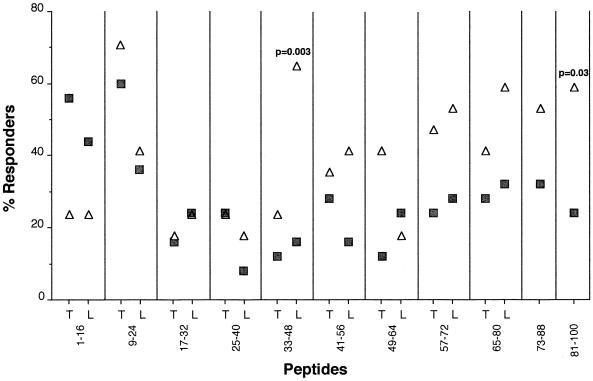
FIG. 1.
Frequency of responders to GroES 16-mer peptides with sequences derived from M. tuberculosis (T) or M. leprae (L). PBMC (2 × 10⁵) from the TBP (full squares) and HS (open triangles) groups were cultured with synthetic peptides (50 μg/ml). Responder status represents individuals with stimulation indexes of greater than 2.5. The significance of differences between the TB and HS groups was evaluated by Fisher's exact test.

