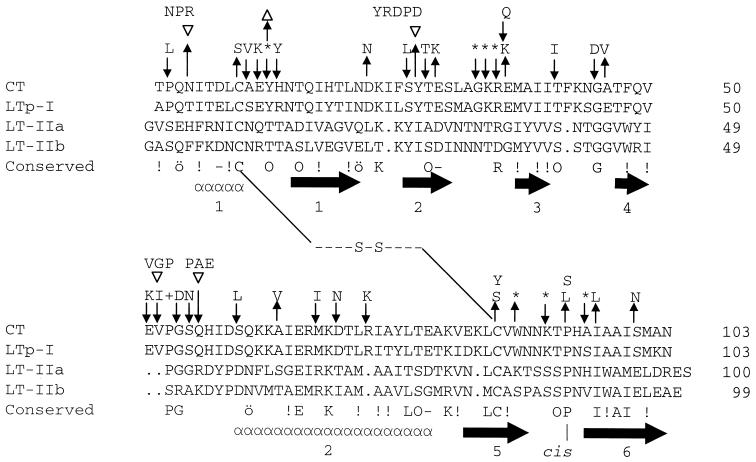
FIG. 3.
Comparison of CTB/LTB family showing regions of secondary structure and location of substitutions in CTB. Gaps introduced to maximize alignment are shown by periods. The disulfide bond linking the two cysteines is shown by - - -S-S- - -. The consensus sequence, defined as those residues occurring in three of four of the family members shown, is shown beneath the aligned sequences. Similar residues are indicated by “ö” for amides (Gln, Asn); “−” for negative charges (Glu and Asp); “O” for hydroxyl groups (Ser, Thr, or Tyr) and “!” for hydrophobic (Ala, Leu, Ile, Val, Met, Phe, and Trp). Below the consensus sequence are shown the number and location of secondary structure elements determined for CT and LT-Ip (“α” symbols show the α-helix; arrows show the β-sheet). “cis” indicates the conserved cis-proline at position 93. LT-Ih differs from LT-Ip only at three or four of the residues T4S, E46A, T75A, and K102E. Substitutions preventing pentamer formation are indicated above the residue substituted (↑), inserted (▿), or deleted (▵). Variants retaining ability to pentamerize are shown above downward arrows (↓). An asterisk indicates that three or more substitution mutants were generated by oligonucleotide mutagenesis.

