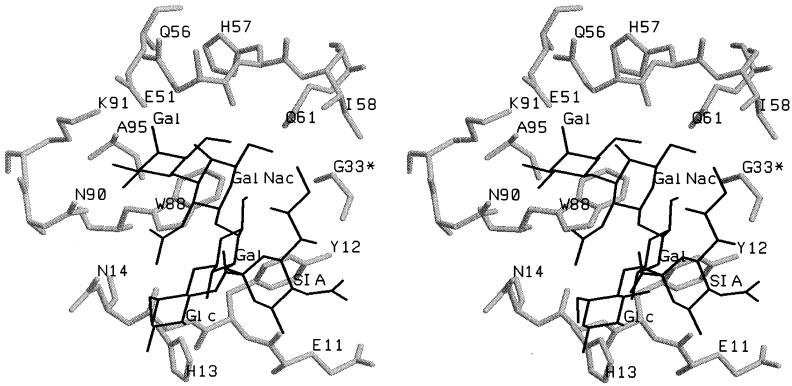
FIG. 9.
Stereo representation of the CTB residues involved in GM1 interaction. Coordinates for CTB-GM1 are from Merritt et al. (26). The oligosaccharide of GM1 is shown in stick form (black), and individual sugars are identified [Gal-GalNac-Gal-(SIA)-Glc]. CTB residues of a single CTB monomer are shown as wire frame representations (gray). G33* shows the sole contribution of the neighboring monomer to the binding site. Variants for all residues shown except N14, I58, Q61, and N90 were isolated in this study.

