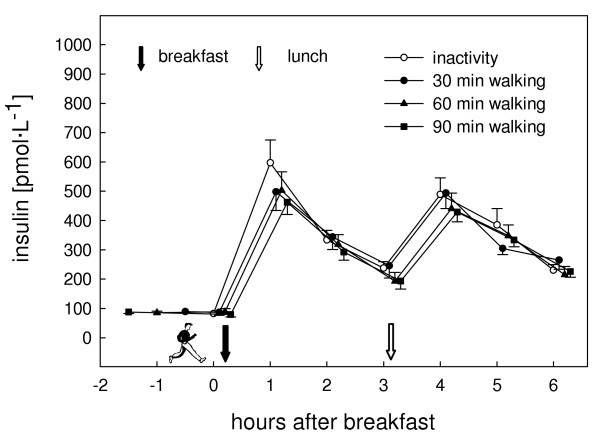
Figure 3.
Insulin concentration for the inactivity and the activity (30, 60, or 90 min treadmill walking) trials. For better readability the symbols of the different trials at the same time points are slightly staggered. Values are means (standard error of the mean). Overall mixed analysis with repeated measurements, effect of trial: P = 0.16.

