. 2004 Nov 22;113(2):143–148. doi: 10.1289/ehp.7467

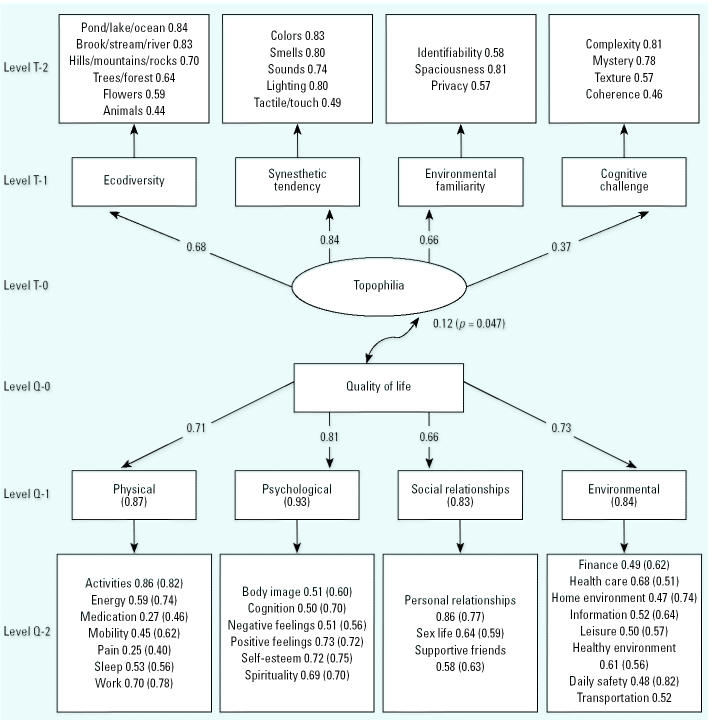
Figure 1. The statistical model of the association between topophilia, QOL, and their proximate determinants. Structural equation modeling was used to generate confirmatory loading factors for the relationships between each of the questionnaire items for topophilia and the standardized WHOQOL-Bref model. Boxes at level T-1 represent the four major domains of topophilia that were revealed by principal components analysis of responses to rating preferences for questionnaire items included in the boxes at level T-2. Level T-0 in the oval shape represents the latent variable of topophilia. Similarly, boxes at level Q-1 represent the four major domains of QOL identified through principal components analysis of responses to questionnaire items at level Q-2. Level Q-0 in the rectangular shape represents measured values for QOL. The factor values not in parentheses are from this study; comparative values for an international field trial of WHOQOL-Bref are included (in parentheses) from the general instrument validation study reported by Skevington et al. (2004).

Figure 1