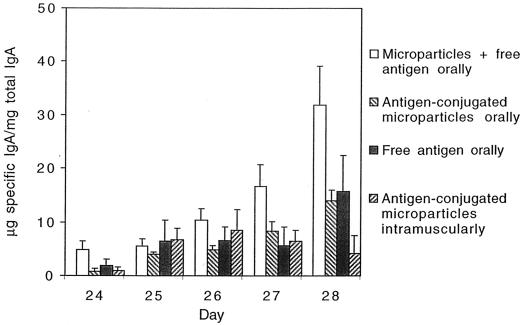
FIG. 4.
Fecal samples analyzed for specific IgA and total IgA. The quota (specific IgA/total IgA) is shown before and 5 days after booster. Values are given as arithmetic means + standard errors of the means (error bars) (n = 6). Microparticles with free antigen administered orally had significantly higher quotas compared to the other groups over time (P < 0.05). No specific IgA was detected in the control group.

