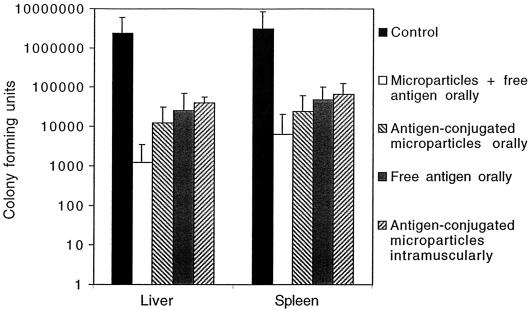
FIG. 6.
CFU in liver and spleen after oral challenge with serovar Enteritidis (3 × 10⁴/mouse). Individual homogenates were plated onto LB-agar plates in serial dilutions in duplicate 7 days after oral challenge. A mean was calculated for each mouse, and the arithmetic means for each group + standard deviations are presented (n = 6 to 12). All oral groups had significantly lower degrees of infection in both liver and spleen compared to those of the control group (P < 0.05), using the logarithmically transformed values in the statistical analysis.

