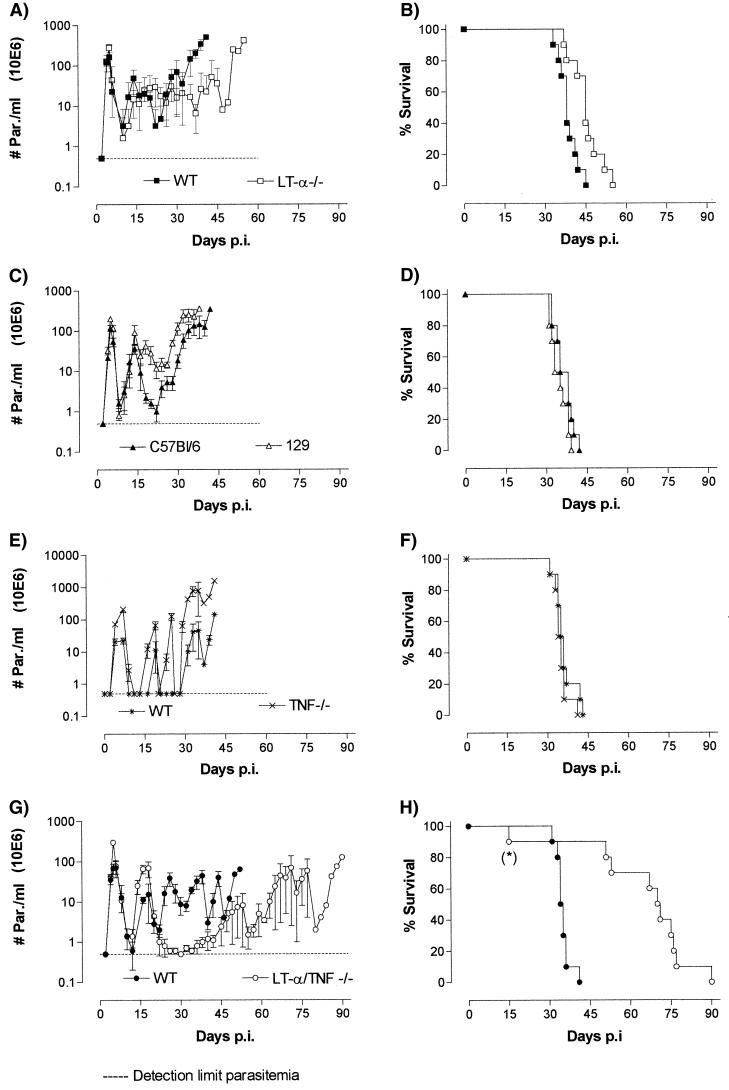
FIG. 1.
(A and B) Parasitemia development in LT-α-deficient mice compared to parasitemia development in control WT mice (A), as well as survival of infected individual mice in both groups (B). p.i., postinfection. (C and D) For reference, parasitemia development in parental C56BL/6J and 129SvImJ (129) mice is also shown (C), as well as the individual survival of these mice (D). (E to H) Parasitemia development (E) and survival (F) of T. brucei-infected TNF-deficient and control (WT) mice (data from reference 20), as well as parasitemia development (G) and survival (H) of infected LT-α-TNF-double-deficient and WT mice, are shown. All results were obtained with experimental groups of 10 mice, and individual experiments were repeated at least two times with similar results. Parasitemia data are presented as mean parasite counts (# Par.) per milliliter of blood ± standard deviations. In the experiment represented in panel H, one LT-α-TNF-double-deficient mouse (∗) died early on day 15 for unknown reasons. This mouse was not taken into account for the calculation of the mean survival time of the whole group.

