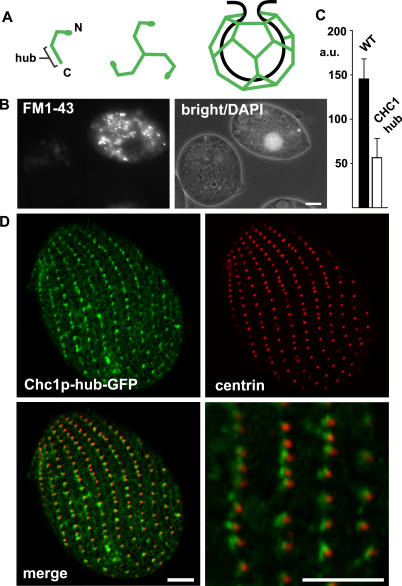
Figure 3. Analysis of CHC.
(A) Cartoon of CHC assembly. The location of the C-terminal hub domain is indicated.
(B) Expression of truncated CHC (hub) inhibits endocytosis. Wild-type (DAPI-labeled) and CHC hub-expressing cells were mixed and incubated with FM1–43. Reduced FM1–43 uptake is detected in the hub-expressing cell.
(C) Quantification of FM1–43 uptake. FM1–43 uptake was quantified by analysis of 20 image pairs such as those shown in (B), as described in Materials and Methods. The fluorescence units are arbitrary (a.u.). WT, wild-type.
(D) Cells expressing Chc1p-hub-GFP (from the MTT1 promoter) were fixed, permeabilized, and labeled with anti-centrin antibody. The merged image shows the close proximity of clathrin hub-GFP to basal bodies, comparable to Figure 2.
Bar = 5 μm (B and D).

