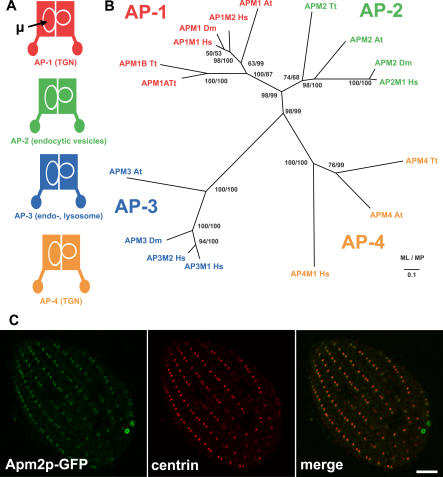
Figure 4. Phylogenetic Analysis and Localization of the AP-2 μ Subunit.
(A) Schematic representation and cellular localization of the heterotetrameric AP complexes. Location of the μ subunit is indicated. TGN, trans-Golgi network.
(B) AP complex μ subunit phylogeny. The topology illustrated is the best maximum likelihood (ML) distance for μ subunits from A. thaliana (At), D. melanogaster (Dm), H. sapiens (Hs), and T. thermophila (Tt). Both ML and maximum parsimony (MP) bootstrap support values are shown at each node.
(C) Fixed, permeabilized cells expressing GFP-tagged AP-2 μ subunit (Apm2p-GFP) (from the MTT1 promoter) were labeled with anti-centrin antibody. The distribution of Apm2p-GFP is similar to that of the CHC hub (Figure 3), but the former is additionally present at the contractile vacuole pores. Bar = 5 μm.

