Figure 2.
Money flow networks for five state tobacco control programs. Arrows indicate direction of money flow, and colored dots represent the relative amount of financial influence each agency had over the rest of the network. All acronyms are spelled out in Appendix C.
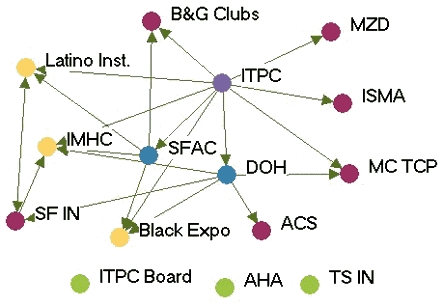
INDIANA
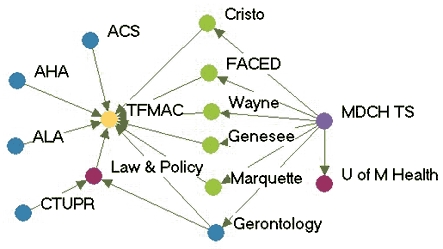
MICHIGAN
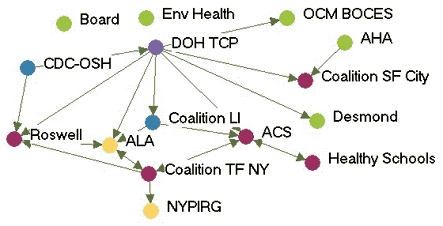
NEW YORK
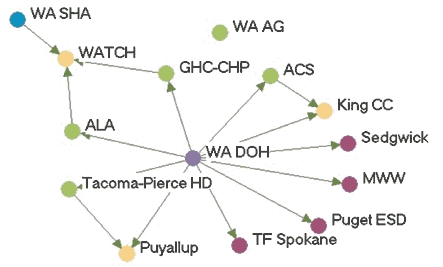
WASHINGTON
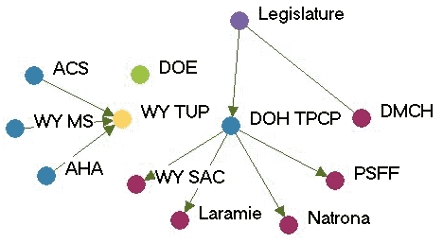
WYOMING
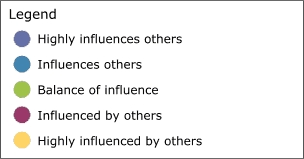
Legend
