Figure 3.
Productivity of relationships in the five state networks. An arrow from A to B indicates that Agency A felt it had a very productive relationship with Agency B. A bidirectional arrow indicates that both agencies agreed that their relationship was very productive. Colored dots represent the prestige each agency had relative to other agencies in the network. All acronyms are spelled out in Appendix C.
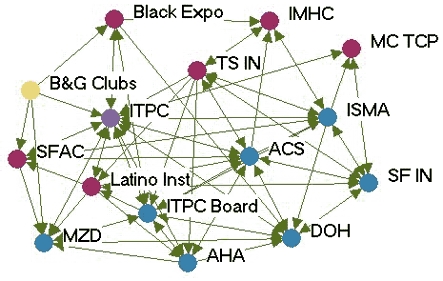
INDIANA
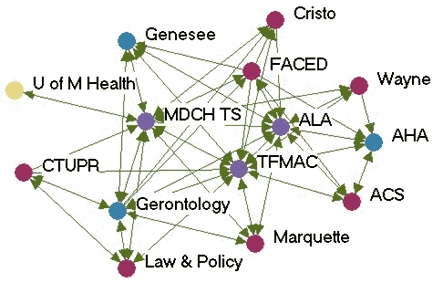
MICHIGAN
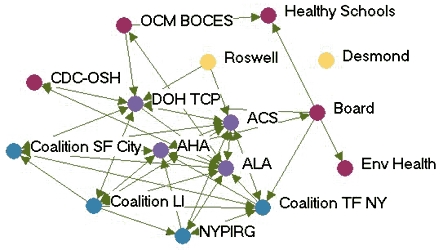
NEW YORK
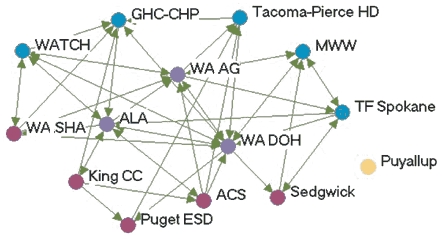
WASHINGTON
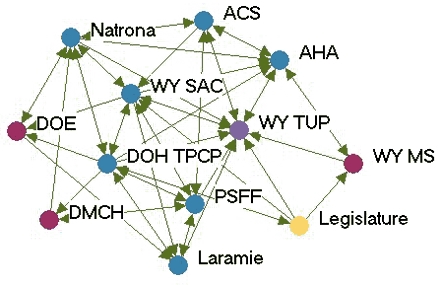
WYOMING
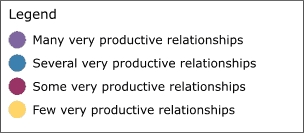
Legend
