
Fig. 6.
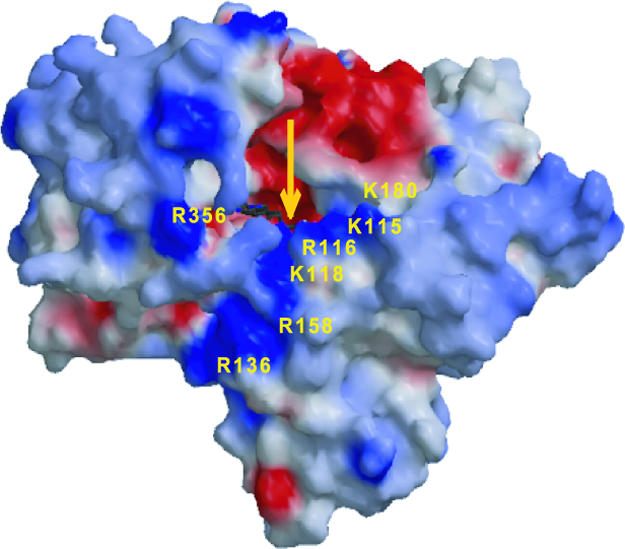
Charge distribution in the MICALfd surface. Positive areas are shown in blue, negative areas are shown in red, and neutral areas are shown in gray. The residues surrounding a strong positive charge feature assumed to be involved in NADPH binding are indicated. The yellow arrow indicates to the location of the FAD isoalloxazine ring.