Fig. 5.
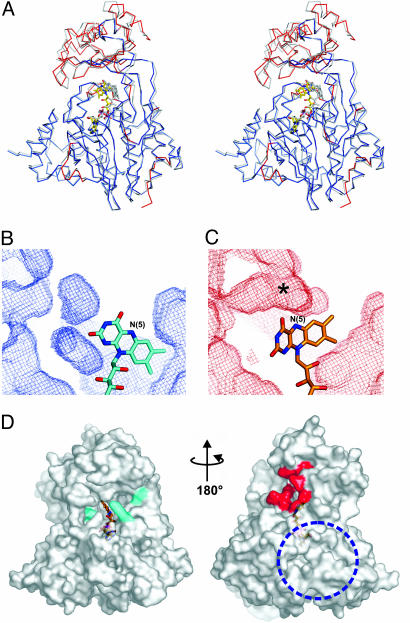
NADPH-induced conformational changes of mMICAL489. (A) Stereo-view of the superposition of oxidized and reduced (gray) mMICAL489. FAD molecules are drawn as sticks. The oxidized form is colored red where there are significant differences between the structures, whereas blue parts are super-imposable [significance level is defined by default criteria of the program escet (37)]. (B and C) Cavities in the oxidized (B) and reduced (C) forms drawn as chicken wire (red, oxidized; cyan, reduced). Both have identical depth slab and orientation, centered on the MO/FAD-binding domain interface (protein atoms are omitted for clarity). The asterisk marks the increase of cavity volume in the reduced form (channel). (D) The solvent-accessible surface of mMICAL489* with the channel entrance highlighted in red (orientation is as in Fig. 1B). Potential NADPH-binding residues are colored cyan. A blue dotted circle marks the patch of basic electrostatic potential. The orientation is as in Fig. 1B.

