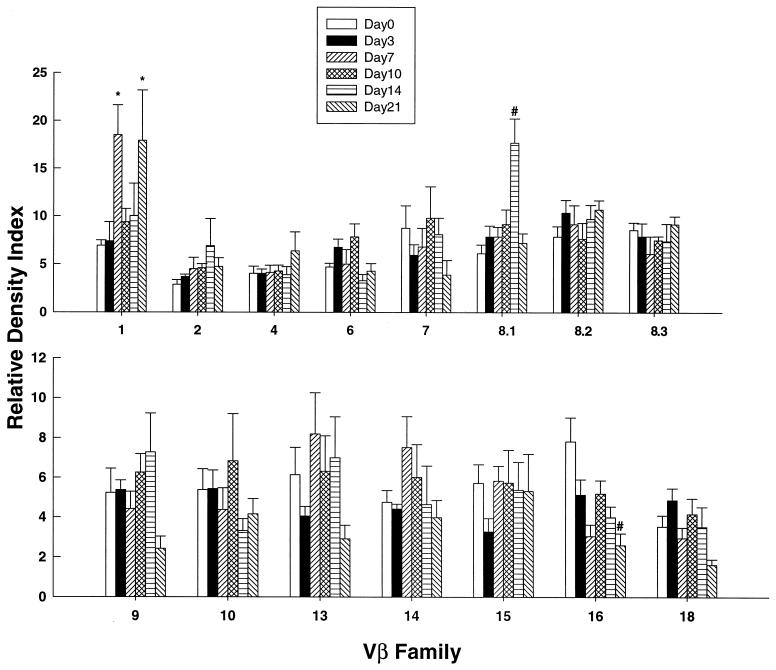
FIG. 2.
TCR usage in lungs of BALB/c mice with secondary infection. The data are expressed as the relative density index at serial intervals of infection. Immunized animals that were not rechallenged are denoted by day zero. The data represent the mean ± SEM of six mice at each time point. *, P < 0.05; #, P < 0.01.

