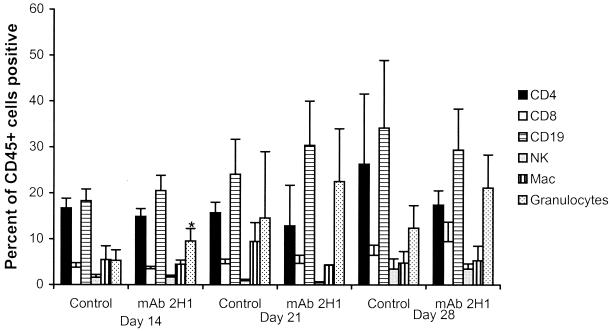
FIG. 3.
Cellular profiles of leukocyte populations in the lungs of mice infected with C. neoformans as determined by FACS analysis (n = 5 mice per group). Percentages represent means; error bars indicate standard deviations. The asterisk indicates a significant difference from control mice on day 14 of infection as determined by the unpaired two-tailed Student t test (P = 0.04).

