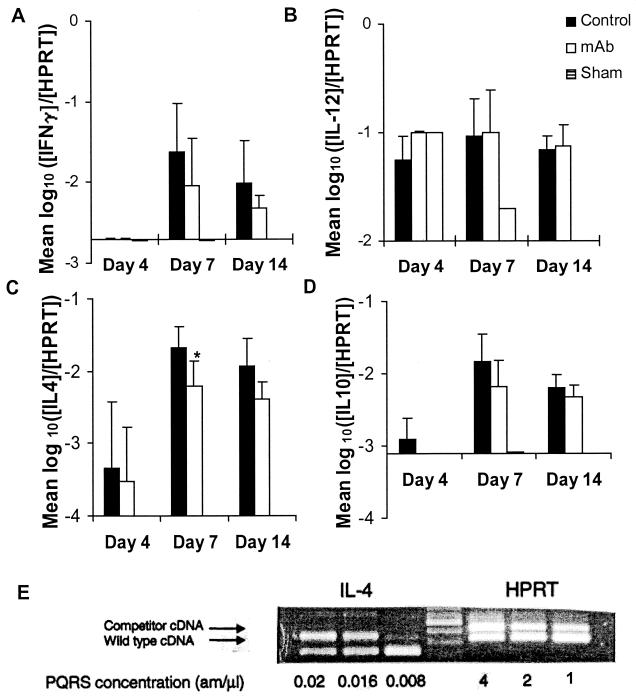
FIG. 5.
Quantitative RT-PCR for expression of mRNA in mice treated with PBS or MAb 2H1 1 day prior to i.t. infection with C. neoformans. (A) IFN-γ; (B) IL-12; (C) IL-4; (D) IL-10. Numbers indicate means; error bars indicate standard deviations. Ratios compare the amount of mRNA for the indicated cytokine to the amount of HPRT in each sample. y axes cross at the limit of detection of the individual cytokines. When mRNA for a cytokine was not detected, the result is reported as the limit of detection. ∗, P = 0.045 compared to control group by the two-tailed Student t test. (E) Representative agarose gel showing determination of cytokine (IL-4) mRNA concentration. The concentration of competitor cDNA at which the wild-type band was of equivalent density defined the wild-type concentration. The amount of wild-type cDNA containing a fixed HPRT concentration (2 am/μl) was used for all measurements reported in panels A through D.

