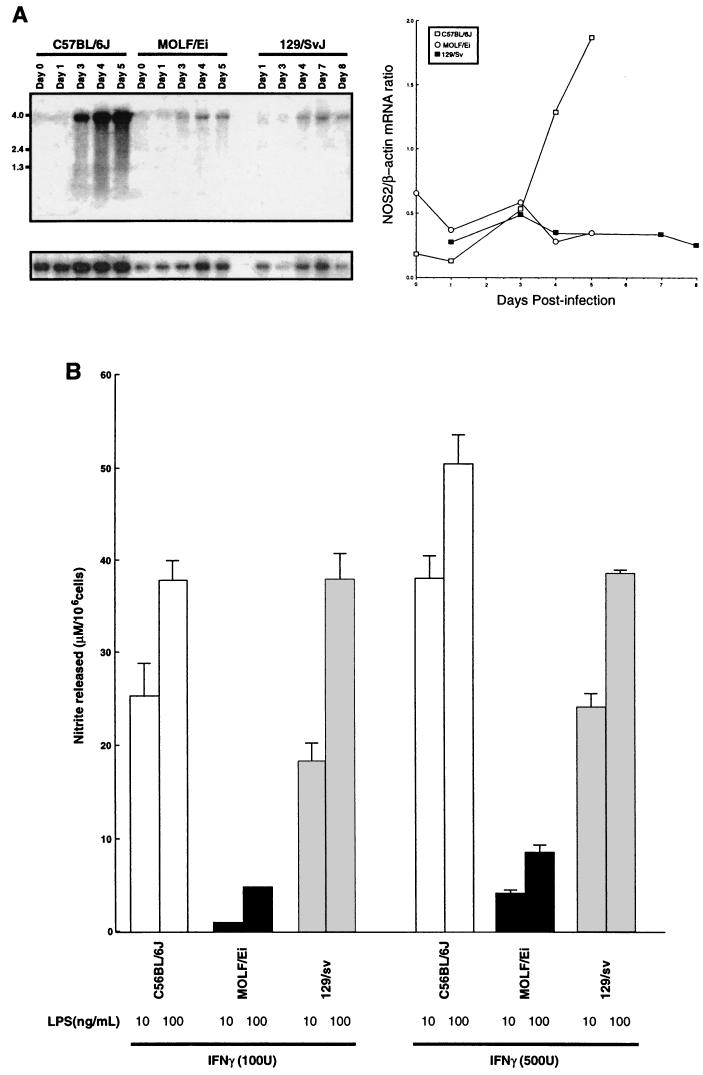
FIG. 6.
Inducible NOS2 activity in MOLF/Ei mice. (A) Northern blot showing Nos2 expression in splenic mRNA isolated from C57BL/6J, MOLF/Ei, and 129/Sv mice following intravenous infection with 0.5 × 10⁴ to 1.0 × 10⁴ CFU of S. enterica serovar Typhimurium. Each lane shows the data for one mouse. The lower panel shows the results obtained with the β-actin control. The panel on the right shows the ratio of the signal intensity for Nos2 mRNA to the signal intensity for β-actin mRNA in the Northern blot. (B) Thioglycolate-elicited peritoneal macrophages were stimulated with various concentrations of IFN-γ and/or LPS for 48 h. The amounts of NO2− in cell-free supernatants were determined by using the Greiss reagent. The data are expressed as means ± standard errors of the means based on duplicate samples for each combination.

