. 2005 Jan 4;113(4):454–460. doi: 10.1289/ehp.7457

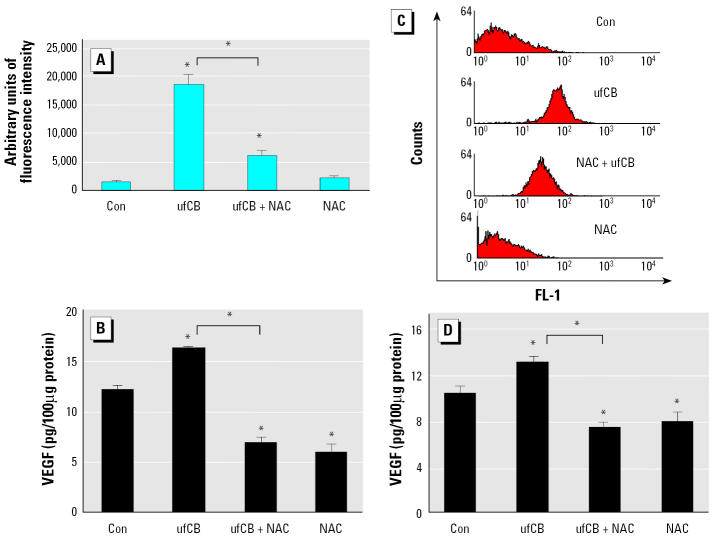
Figure 6. Effect of NAC (20 mM, 1-hr pretreatment) on oxidative stress and cellular VEGF production in cells treated with ufCB (100 μg/mL) for 4 hr. (A) Oxidative stress in THP-1 cells. Data are expressed as means ± SE of four or five separate experiments; ufCB group, n = 5. (B) Cellular VEGF in THP-1 cells. (C) A representative histogram in which the fluorescence (FL-1) is plotted against the number of A549 cells. Ratios of mean fluorescence intensity of treated cells to PBS control: control (Con), 1; ufCB, 11.6; NAC + ufCB, 6.19; NAC, 0.71. (D) Cellular VEGF in A549 cells. Data are expressed as means ± SE of four (THP-1) or three (A549) separate experiments. : *Significantly different from the control or between the ufCB + NAC group and the ufCB group (p < 0.01).

Figure 6