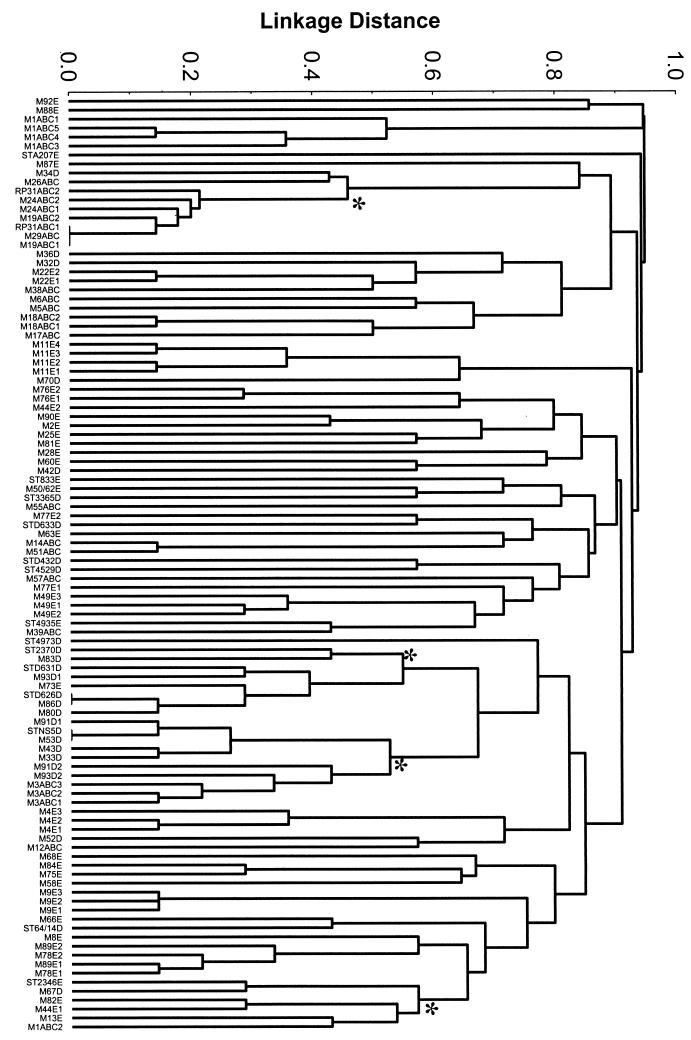
FIG. 1.
Cluster analysis of strains of defined emm pattern. The dendrogram was constructed using UPGMA and shows all unique emm type-ST combinations (n = 104). Labels at branch tips indicate emm type, followed by emm pattern group (A-C [ABC], D, or E); for cases where there is more than one ST associated with a given emm type, the string ends with a numerical assignment. In all instances, isolates of a given emm type share the same emm pattern grouping. Large asterisks denote nodes at linkage distances of ≤0.6, with descendants represented by six or more distinct clones (i.e., STs) and/or emm types. From the top of the dendrogram, the clusters are comprised of the following numbers of distinct emm types, STs, and emm patterns: cluster 1, six emm types and six STs (five of pattern A-C, one of pattern D); cluster 2, eight emm types and seven STs (six of pattern D, one of pattern E); cluster 3, seven emm types and nine STs (three of pattern A-C, six of pattern D); cluster 4, six emm types and six STs (one of pattern A-C, one of pattern D, four of pattern E).

