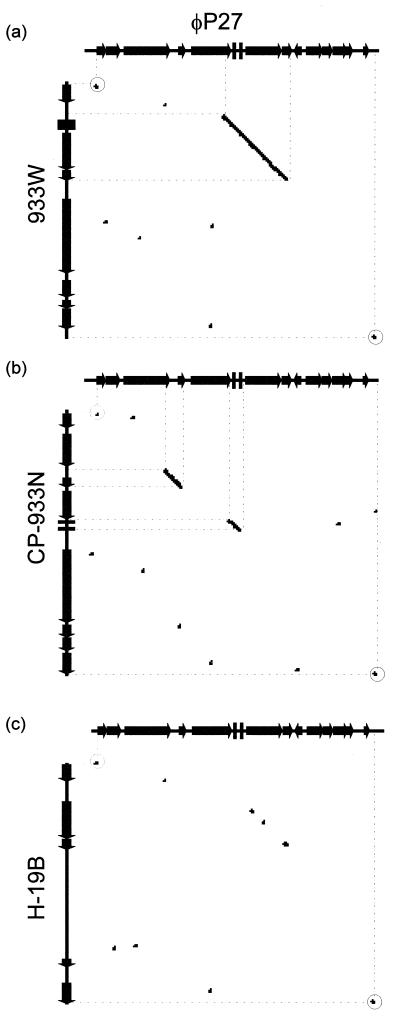
FIG. 4.
Dot blot matrix of the stx2e-flanking region of φP27 (genes Q to L32) and corresponding regions of phages 933W (a), CP-933N (b), and H-19B (c). At every point in the matrix where the two sequences are identical a dot is placed. A diagonal stretch of dots indicates regions where the two sequences are similar. Dots with circles represent linkers 3 (left side) and 4 (right side).

