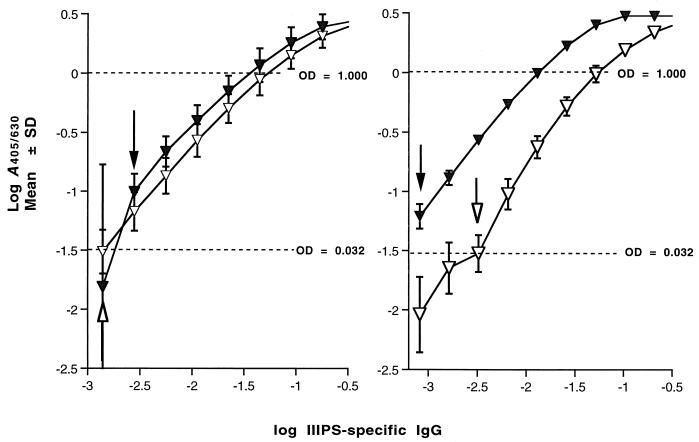
FIG. 2.
Standard curves from the GBS III ELISA show a relationship between the quantity of specific immunoglobulin and A405/630. (Left panel) Reaction of reference serum 19 with plates coated with III-HSA (filled triangles) or IIIPS + mHSA (open triangles). (Right panel) Reaction of SHRS III with plates coated with III-HSA (filled triangles) or IIIPS + mHSA (open triangles). The arrows indicate the sensitivities of the III-HSA ELISA (filled arrows) and the IIIPS + mHSA ELISA (open arrows). The results represent means ± SDs for six experiments.

