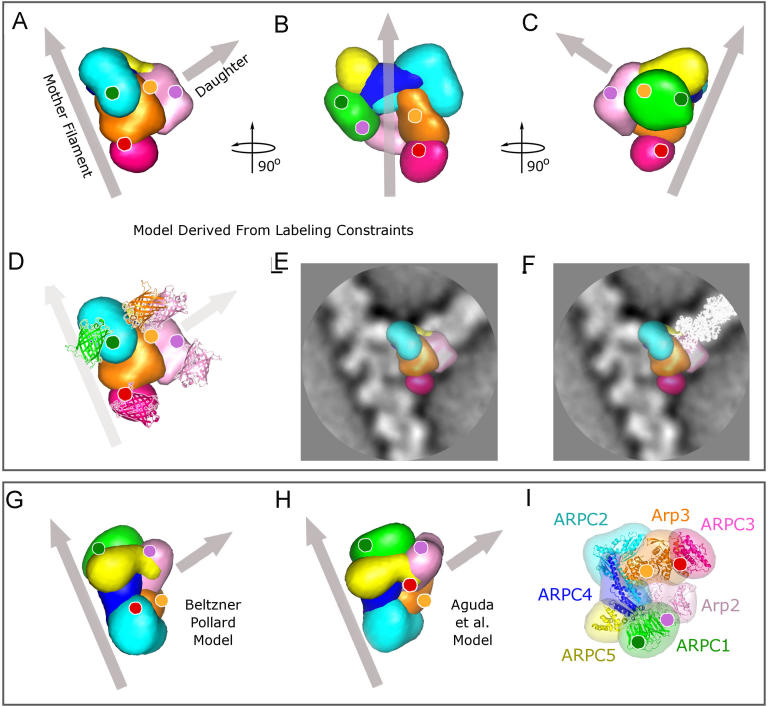
Figure 4. Structure Models of the Arp2/3 Complex at Actin Branch Junction.
Color codes used: Arp2 (light pink), Arp3 (orange), Arc40/ARPC1 (green), Arc35/ARPC2 (cyan), Arc19/ARPC4 (blue), Arc18/ARPC3 (dark pink), and Arc15/ARPC5 (yellow). Gray arrows indicate the mother and daughter filaments.
(A) Orientation of the Arp2/3 complex relative to the mother and daughter filaments as determined using the labeling constraints.
(B) Model rotated vertically anticlockwise by 90° from view in (A) and tilted so that the mother filament coincides with the vertical axis. The gray arrow is positioned to pass through the center of the complex.
(C) Model rotated vertically by 180° from the view in (A).
(D) Label positions and their corresponding C-termini localization. GFP or YFP, shown as ribbon diagram with the same color coding as in Figure 3, were superimposed on the respective difference peak (Figure 3) with their orientation matching the peak shape.
(E) Model superimposed on the projection density map (white corresponds to high density).
(F) Model and ribbon diagram of a daughter filament (white) as it would grow after small relative rotations of Arp2 and Arp3 (see text) superimposed on the projection density map.
(G and H) Model proposed by Beltzner and Pollard [6] (G) and by Aguda et al. [5] (H) shown for comparison. Note that in (G), the daughter filament will be oriented out of the paper plane toward the reader.
(I)Arp2/3 crystal structure in the same orientation as originally presented in Robinson et al. [12].

