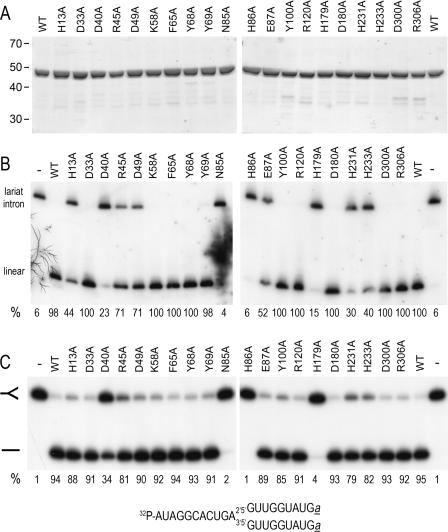
Figure 4.
Effect of Dbr1-Ala mutations on debranching in vitro. (A) Aliquots (3 µg) of the heparin Sepharose preparations of wild-type Dbr1 (WT) and the indicated Dbr1-Ala mutants were analyzed by SDS–PAGE. The Coomassie blue-stained gel is shown. The positions and sizes (kDa) of marker proteins are indicated at the left. (B) Total Δdbr1 RNA (10 µg) was incubated with 100 ng of the indicated proteins for 1 h at 30°C. The products were analyzed by northern blotting. The membrane was probed for the U3 intron RNA. Hybridized 32P-labeled probe was visualized by autoradiography and quantified with a phosphorimager. The percent linear product is indicated below each lane. (The value for N85A was determined from a different blot.) (C) Reaction mixtures (20 µl) containing 4 ng Dbr1 (WT) and the mutant proteins as indicated and 200 fmol of 5′-labeled RNA oligonucleotide were incubated for 10 min at 22°C. The products were analyzed by denaturing PAGE. The 32P-labeled RNA was visualized by autoradiography. The positions of branched RNA oligonucleotide and the linear product are indicated by the symbols at the left. The amount of linear product as a percentage of total RNA is noted below each lane. The branched RNA substrate is depicted at the bottom. Ribonucleotides are indicated by capital letters; a denotes 3′-terminal L-dA residues (40,41).

