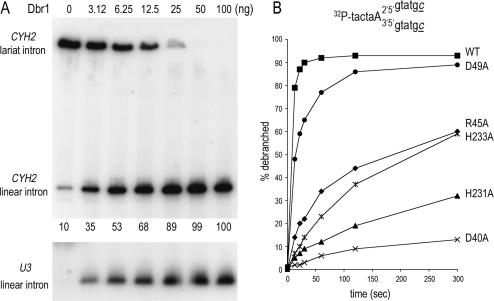
Figure 5.
Enzyme-dependence and timecourse analysis of debranching. (A) Aliquots (10 µg) of total RNA isolated from dbr1Δ cells were incubated with increasing amounts of Dbr1 for 1 h at 30°C. The samples were analyzed by northern blotting. The membrane was hybridized with a probe specific for the CYH2 intron (top panel) and U3 intron (bottom panel) and the hybridized 32P-labeled probes were visualized by autoradiography. The percent linear CYH2 intron is indicated below the lanes in the top panel. (B) Wild-type Dbr1 (4 ng) and the indicated Dbr1-Ala mutants were incubated at 22°C with 100 fmol of 5′ 32P-labeled synthetic branched substrate (illustrated on top; deoxyribonucleotides are indicated by small letters, ribonucleotides by capital letters; c denotes 3′-terminal L-dC residues) (40,41). Aliquots were withdrawn at 13, 22, 30, 60, 120 and 300 s. The samples were analyzed by denaturing PAGE. The amount of linear product, as a percentage of total RNA, is plotted as a function of time.

