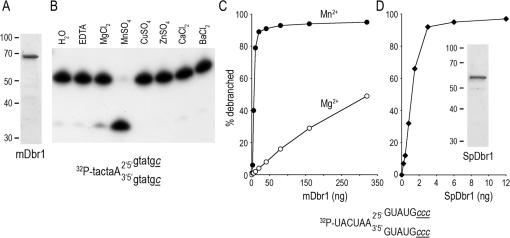
Figure 9.
Debranching activities of mouse and S.pombe Dbr1. (A) An aliquot (2 µg) of the mDbr1 preparation was analyzed by SDS–PAGE. The Coomassie blue-stained gel is shown; the positions and sizes of marker polypeptides are indicated at the left. (B) Reaction mixtures (20 µl) contained 200 fmol of the 5′-labeled branched oligonucleotide substrate shown, 2.5 mM of the indicated metal cofactor, 50 mM Tris-acetate (pH 6.5), 2.5 mM DTT, 25 mM NaCl, 0.01% Triton X-100, 0.1 mM EDTA, 0.15% glycerol and 320 ng mDbr1. The products were analyzed by denaturing PAGE. An autoradiogram of the gel is shown. (C) Increasing amounts of mDbr1 were incubated with 200 fmol of the indicated 5′-labeled branched oligonucleotide substrate (shown at bottom) in the presence of either MgCl2 (2.5 mM) or MnCl2 (4 mM) for 10 min at 22°C. The extent of debranching is plotted as a function of input mDbr1. (D) S.pombe Dbr1. Reaction mixtures (20 µl) contained 200 fmol of the indicated 5′-branched oligonucleotide, 4 mM MnCl2 and SpDbr1 as specified. The inset shows the polypeptide composition of the SpDbr1 preparation (2 µg), as gauged by SDS–PAGE and Coomassie blue-staining.

