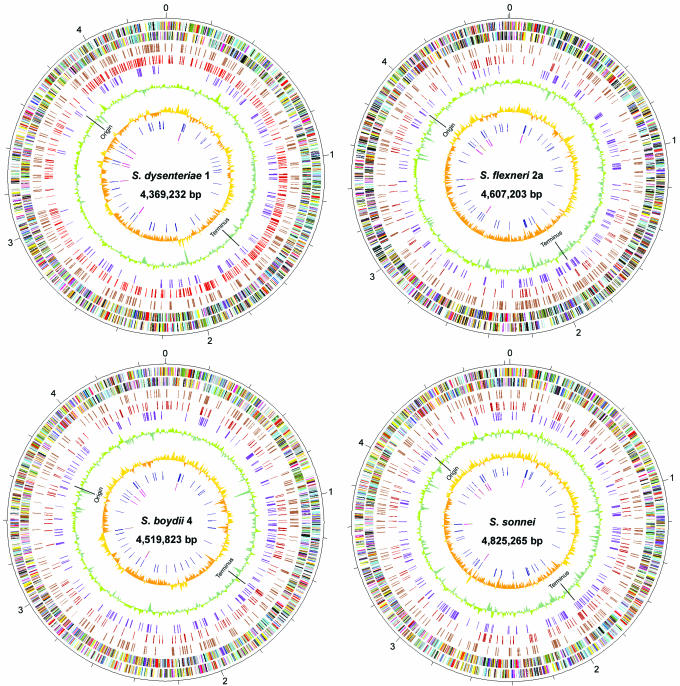
Figure 1.
Circular representations of the Shigella genomes. The outer scale is marked every 200 kb. Circles range from 1 (outer circle) to 9 (inner circle). Circles 1 and 2, ORFs encoded by leading and lagging strands, respectively, with colour code for functions: salmon, translation, ribosomal structure and biogenesis; light blue, transcription; cyan, DNA replication, recombination and repair; turquoise, cell division; deep pink, posttranslational modification, protein turnover and chaperones; olive drab, cell envelope biogenesis; purple, cell motility and secretion; forest green, inorganic ion transport and metabolism; magenta, signal transduction; red, energy production; sienna, carbohydrate transport and metabolism; yellow, amino acid transport; orange, nucleotide transport and metabolism; gold, co-enzyme transport and metabolism; dark blue, lipid metabolism; blue, secondary metabolites, transport and catabolism; grey, general function prediction only; black, function unclassified or unknown. Circle 3, distribution of pseudogenes. Circles 4 and 5, distribution of IS1/IS1N and other IS-species, respectively. Circles 6 and 7, G+C content and GC skew (G-C/G+C), respectively, with a window size of 10 kb. Circles 8 and 9, distribution of tRNA genes and rrn operons, respectively. The replication origin and terminus are indicated for each. (The circular map for Sf301 was created based on the updated annotation.)

