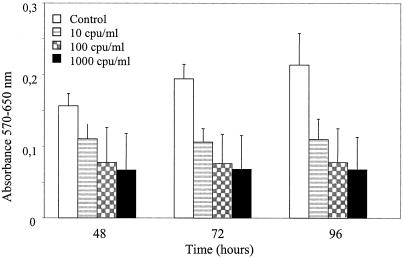
FIG. 1.
The influence of HdCDT on the metabolic activity of HMVEC-d cells was measured by using MTT. White bars represent controls (PBS) and shaded bars represent cells treated with 10, 102, or 103 CPU of HdCDT per ml. The data are shown as the means ± standard deviations of two representative and independent experiments performed in triplicate.

