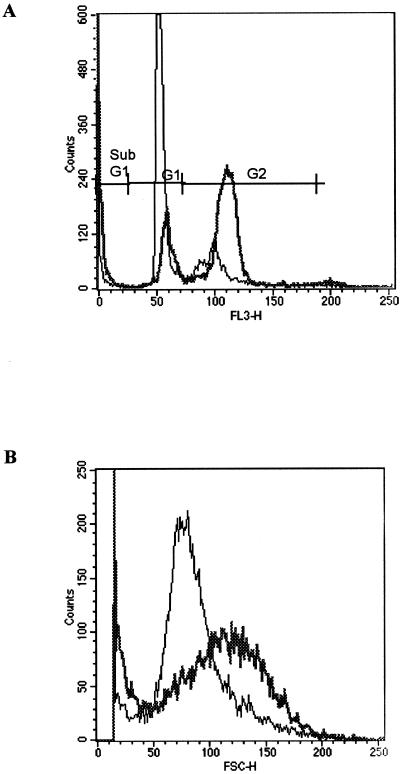
FIG. 2.
(A) Influence of HdCDT on cell cycle progression. The percentage of cells in the G2 phase of the cell cycle was increased. (B) Cells treated with HdCDT were increased in size compared to the control (PBS-treated) cells. The thin line represents the control. The thick line represents HdCDT. Data are from one of four representative experiments.

