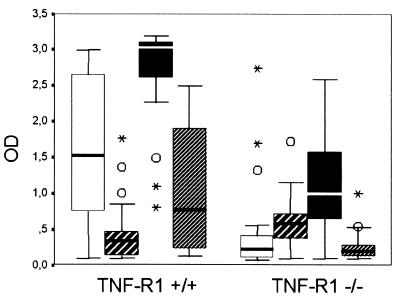
FIG. 2.
Box plots with medians, minimum and maximum values, upper and lower quartiles, outliers (○), and extremes (asterisks) of IgG subclass antibody responses (optical density [OD] in ELISA analysis) to H. pylori in infected TNF-R1-deficient mice (TNF-R1−/−, n = 19) and controls (TNF-R1+/+, n = 24). Significantly higher titers were found for IgG1 (open bars) (P = 0.0002), IgG2b (solid bars) (P < 0.0001), and IgG3 (bars with narrow cross-hatching) (P = 0.0008), but not for IgG2a (bars with broad cross-hatching) (P = 0.596), in infected isogenetic controls than in TNF-R1-deficient mice.

