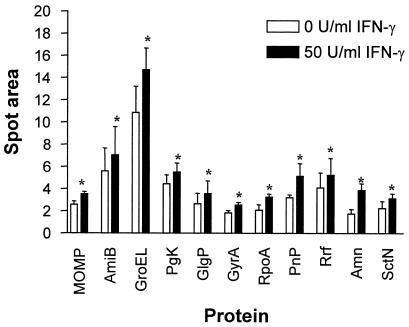
FIG. 3.
Statistical analysis of upregulated C. pneumoniae proteins in response to IFN-γ. Spot volumes were calculated from each protein under normal or IFN-γ conditions by using Bioimage. Numerical data were collected from a minimum of five experiments per experimental condition and subjected to a Mann-Whitney test. Bars indicate the means ± standard errors of the means. ∗, P < 0.05.

