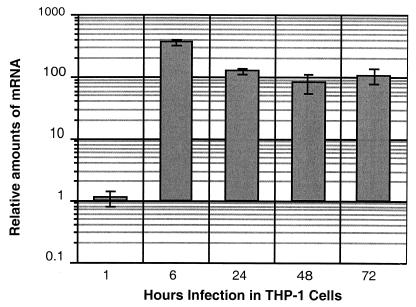
FIG. 4.
Changes in hspX mRNA levels during growth in THP-1 cells. The results are expressed as the ratios of the numbers of RNA copies detected in RNA samples taken at various times (shown on the x axis and expressed in hours) from cultures of M. tuberculosis H37Rv to the numbers of RNA copies detected in samples obtained from bacteria growing in 7H9 medium. The values were normalized to the sigA RNA value. Each measurement was obtained at least twice using independent RNA preparations.

