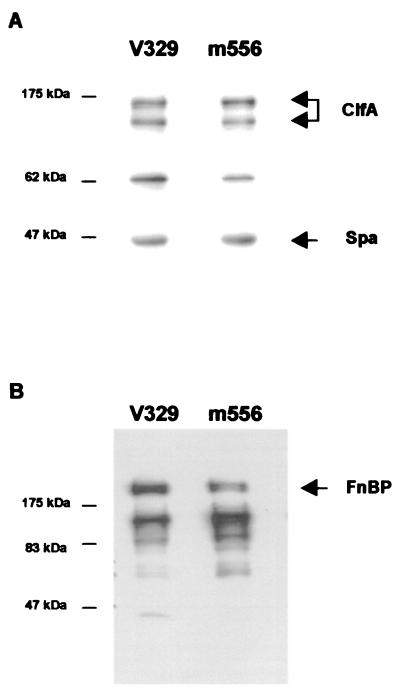
FIG. 3.
Visualization of ClfA protein (A) and FnBPs (B) by Western blotting and ligand affinity blots, respectively. Positions of protein size markers are shown at the left of each panel. Bands corresponding to native and truncated ClfA proteins, FnBPs, and Spa are identified. Similar amounts of ClfA, FnBPs, and protein A released into the supernatant by protoplasts stabilized in raffinose were observed in V329 and m556.

