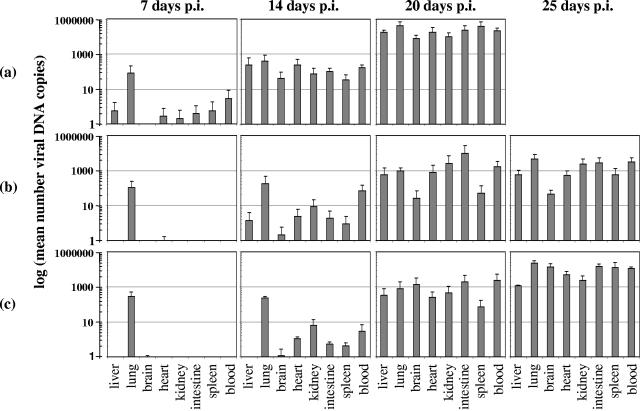
FIG. 3.
Effect of antiviral therapy on viral DNA levels in infected tissues of placebo (a), cidofovir-treated (b), and S-2242-treated (c) mice at different times p.i. Data are presented as logarithmic means of the number of viral DNA copies per ng chromosomal DNA. Each bar represents the mean value ± standard deviation of the results for 4 mice.

