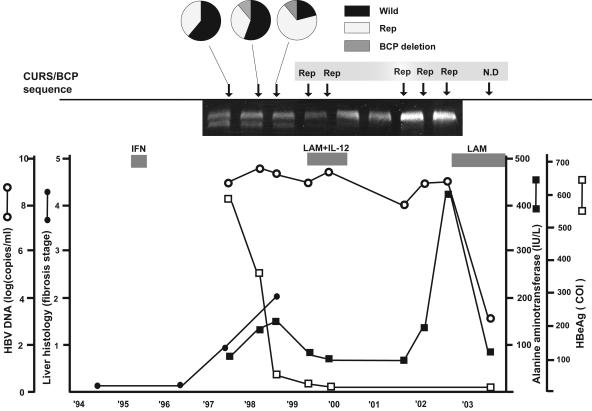
FIG. 3.
Clinical course of patient 2 based on HBV DNA levels, fibrosis stage, HBeAg titer, and ALT levels. The three circular charts show how the proportions of wild type, replacement mutation (Rep) type, and BCP deletion type changed during the time course. The electropherogram (5%) shows that mixed types (wild type and Rep) are found during the first three points. ○, HBV DNA levels; •, fibrosis stage; □, HBeAg titer; ▪, ALT levels. The patient was treated with IFN monotherapy and then with the combination therapy of lamivudine (LAM) and interleukin-12 (IL-12). The patient has been treated with LAM since 2003. COI, cutoff index.

