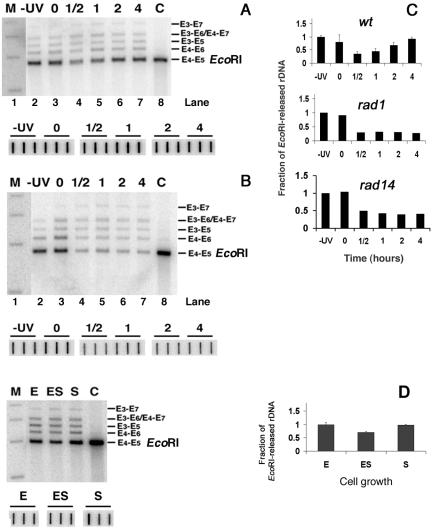
FIG. 7.
EcoRI accessibility to rDNA chromatin during NER and during cell growth. (A) Chromatin structure of ribosomal genes during NER in wt cells (top gel). Nuclei were isolated from nonirradiated (−UV; lane 2) or irradiated (lanes 3 to 7) cells, before (lane 3) and during (lanes 4 to 7) NER. After EcoRI digestion, DNA was extracted from nuclei and separated on 1% native agarose gels. As a control (C), DNA was isolated from nuclei and digested with EcoRI (lane 8). After being blotted, the filter membranes were hybridized with the random primer-labeled probe (Fig. 1B) to obtain the major band E4-E5 (EcoRI; 2,846 bp). The bands E3-E7 (4,468 bp), E3-E6 (3,877 bp), E4-E7 (3,804 bp), E3-E5 (3,510 bp) and E4-E6 (3,213 bp) are products of partial digestions (Fig. 1B). DNA size-markers (lane M): 5,090, 4,072, 3,054 and 2,036 bp. To correct for gel loading, the amount of total rDNA present in each sample was quantified by spotting aliquots of DNA in triplicate (bottom gel). The membranes were hybridized with the probe shown in Fig. 1B and exposed to phosphorimager screens. The average of each triplicate was used to correct for loading. (B) Chromatin structure of ribosomal genes during NER in rad1Δ strains. Experimental procedure and lanes are as described for panel A. (C) For wt cells, signals for the E4-E5 (EcoRI) bands were quantified, and, after corrections for DNA loading, the rDNA signals were normalized to the −UV samples (given an arbitrary value of 1). The EcoRI sensitivity of the other samples is expressed relative to this value (data are the means ± 1 SD of three experiments). Similar analyses were performed with gels from rad1Δ and rad14 Δ cells. Data show the average of two independent experiments each. (D) Chromatin structure of ribosomal genes during cell growth. Nuclei isolated from cells collected at selected growth stages (Fig. 6A) were digested with EcoRI. DNA was extracted and separated on 1% native agarose gels. As a control (C), DNA was isolated from nuclei and digested with EcoRI. After being blotted, membranes were hybridized with the random primer-labeled probe (Fig. 1B). Lanes are as described for Fig. 6A, and quantification of the gel (right panel) was performed as described for panel C. Data are the means ± 1 SD of three independent experiments.

