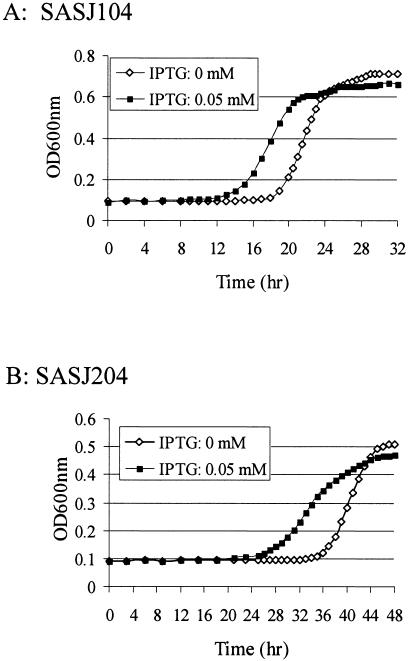
FIG. 4.
Growth curves of the Pspac-regulated yhcS (A) and yhcR (B) mutants during the induction of yhcS or yhcR expression with IPTG. S. aureus strains were incubated at 37°C overnight in TSB with appropriate antibiotics. The cultures were diluted to ∼104 CFU/ml with TSB containing appropriate antibiotics and different concentrations of inducer (IPTG at concentrations of 0, 0.2, 50, or 4,000 μM). Cell growth was monitored at 37°C by measuring the optical density at 600 nm (OD600nm) every 15 min, with 1 min of mixing before each reading using a SpectraMax plus Spectrophotometer (Molecular Devices). The figure represents one of three repeated experiments.

