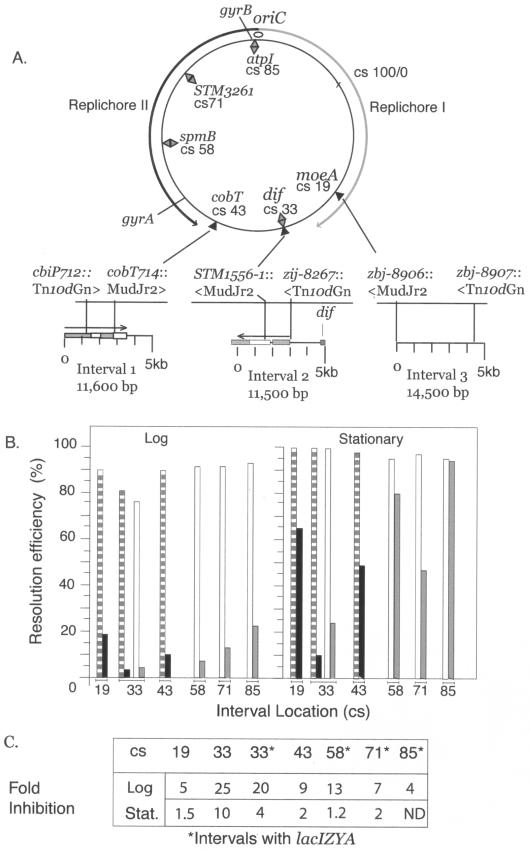
FIG.3.
A. Genetic and physical map of the S. enterica serovar Typhimurium chromosome. Intervals analyzed with Tn3 resolution assays are shown for seven map positions on the standard 100-CS Salmonella map. Replichore I goes from oriC clockwise, while replichore II goes counterclockwise. The map coordinates for intervals defined by transposon insertions are indicated by black triangles, and inserted Lac modules are indicated by diamonds. B. The data for resolution efficiencies shown in Table 2 for three transposon-defined intervals at CS 43, CS 33, and CS 19 are shown as striped bars for WT gyrase and black bars for GyrB652. Resolution efficiencies for deletion of Lac intervals are indicated by white bars for WT gyrase and gray bars for GyrB652. C. Relative to WT gyrase, the reduction in recombination efficiency for GyrB652 derivatives is shown for all chromosomal positions.

