
Figure 2.
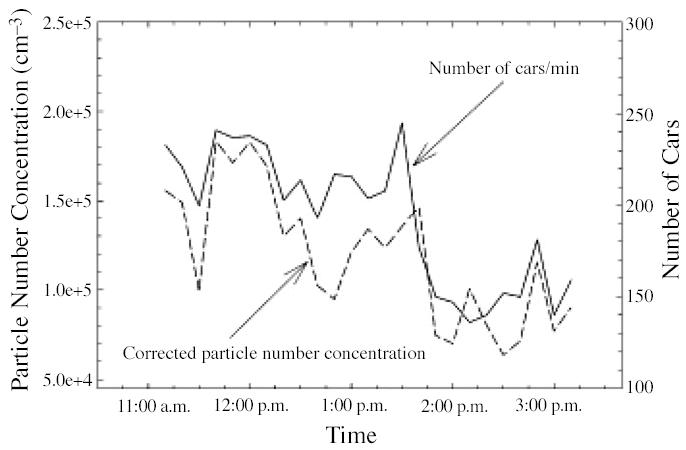
Correlation between traffic density and measured total PN concentration, corrected for wind velocity, 30 m downwind from the freeway. Reprinted with permission from Zhu et al. (2002b). Copyright 2002 Air and Waste Management Association.
Official websites use .gov
A
.gov website belongs to an official
government organization in the United States.
Secure .gov websites use HTTPS
A lock (
) or https:// means you've safely
connected to the .gov website. Share sensitive
information only on official, secure websites.
Correlation between traffic density and measured total PN concentration, corrected for wind velocity, 30 m downwind from the freeway. Reprinted with permission from Zhu et al. (2002b). Copyright 2002 Air and Waste Management Association.