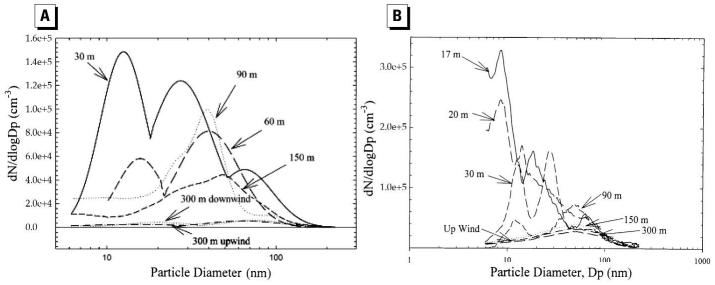
Figure 3.
UFP size distribution at different sampling locations near (A) the I-405 freeway [reprinted with permission from Zhu et al. (2002b); copyright 2002 Air and Waste Management Association] and (B) the I-710 freeway [reprinted from Zhu et al. (2002a); copyright 2002, with permission from Elsevier].

