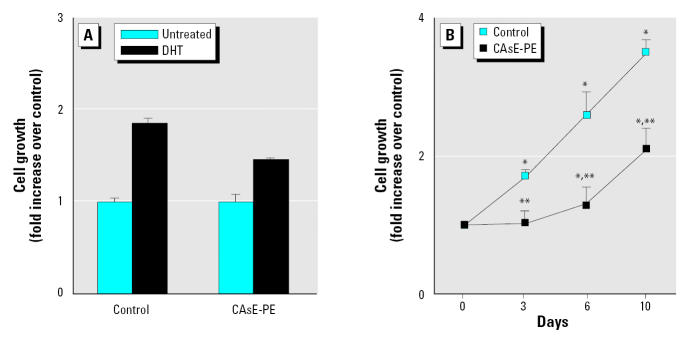
Figure 3.
Effect of DHT on the growth of control and CAsE-PE cells. (A) Cells were plated in the presence of 0.1 μM DHT, harvested at 7 days, and counted; growth stimulation by DHT was normalized to the control cells (set as 1.0). (B) Time course of growth stimulation of normal and arsenic-transformed prostate epithelial cells by 0.1 μM DHT; the total cell numbers were counted on days 3, 6, and 10. Densitometric data are given as fold increase over control and are expressed as means (n = 3); error bars represent SE.
*Significantly different from untreated, cell-line–matched cells. **Significantly different from control cells treated with DHT.

