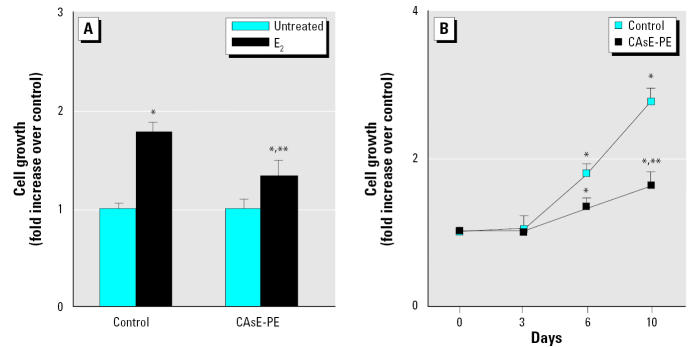
Figure 7.
Effect of E2 on the growth of control (RWPE-1) and CAsE-PE cells plated in the presence of 1 μM E2, harvested at 7 days, and counted. (A) Growth stimulation by E2 normalized to the control cells (set as 1.0). (B) Time course of growth stimulation of normal and arsenic-transformed prostate epithelial cells by 1 μM E2. Total cell numbers were counted on days 3, 6, and 10; the data shown are the means and SEs of triplicates. Similar results were found in two independent experiments. Densitometric data are given as fold increase over control and are expressed as means (n = 3); error bars represent SE.
*Significantly different from untreated cell-line–matched cells. **Significantly different from control cells treated with E2.

