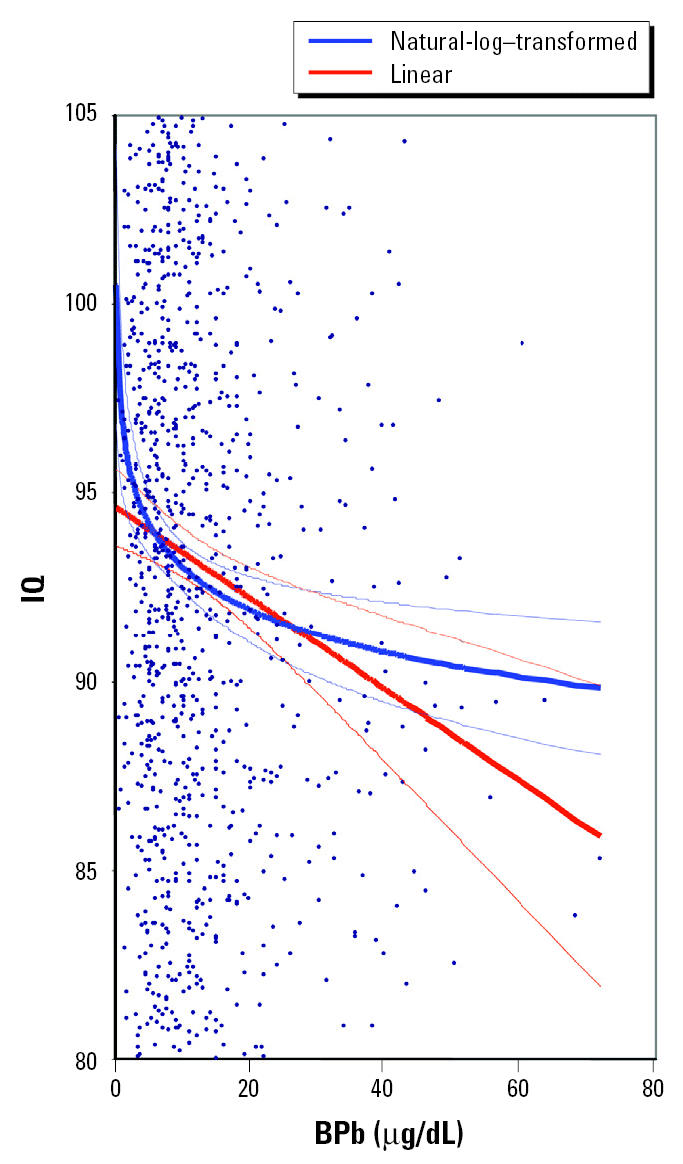
Figure 1.

Partial regression plot of adjusted IQ (adjusted for natural-log lead model) and BPb (from Lanphear et al. 2005). The two regression lines (bold) with 95% CIs (narrow lines) represent the best-fit estimates of the relationship between IQ and BPb for natural-log–transformed BPb and linear BPb. Note that the linear BPb term overestimates the slope (change in IQ with change in BPb) of the statistically superior natural-log lead function down to 15 μg/dL and underestimates the slope < 15 μg/dL. The scatter plot does not show all data points because the y-axis has been expanded to show differences in regression functions.
