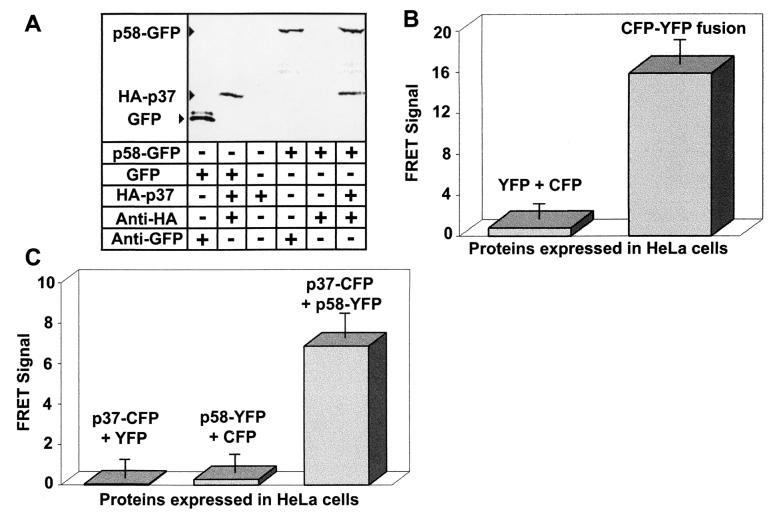
FIG. 1.
VacA domain interactions. (A) In vitro interactions. 35S-radiolabeled HA-p37, HA-p58, p37-GFP, p58-GFP, and GFP were synthesized by in vitro transcription and translation as described in Materials and Methods. Equimolar concentrations (0.5 nM) of the indicated recombinant proteins were added to Eppendorf tubes and were incubated for 1 h at 37°C in PBS, pH 7.2 (final volume, 500 μl). The protein mixtures were then incubated with 10 μl of protein G agarose beads in the presence (+) or absence (−) of 5 μl of the indicated antibodies for 30 min. After incubation, the beads were washed five times with 500 μl of 20 mM Tris, pH 8.0, 25 mM NaCl, and 0.2% Tween 20. The bound proteins were dissociated from the beads by denaturation in sample buffer and resolved on SDS-12% PAGE. The gel was dried and exposed to a phosphorimaging plate overnight. (B) FRET positive and negative controls. HeLa cells were infected with vT7 and were then transfected with plasmids expressing the indicated fluorescent proteins as described in Materials and Methods. After 18 to 24 h, the fluorescence emission of the transfected cells was analyzed by fluorescence microscopy. Images were collected for each slide using a CFP filter set (excitation at 436 nm and fluorescence emission at 480 nm), a YFP filter set (excitation at 500 nm and emission at 535 nm), and a FRET filter set (excitation at 436 nm and emission at 535 nm). Fluorescence images were collected for cells cotransfected with plasmids encoding CFP and YFP separately (left) or the CFP-YFP fusion positive control (right). The data were manipulated as described in the text. Values represent the average of at least 12 independent cells and 3 independent experiments. (C) p37 and p58 interact in trans. HeLa cells were infected with vT7 and were then cotransfected with plasmids expressing the indicated fluorescent protein fusions as described in Materials and Methods. After 18 to 24 h, images were collected and processed as described in Materials and Methods and for panel B above. Values represent the average of at least 12 independent cells and 3 independent experiments.

