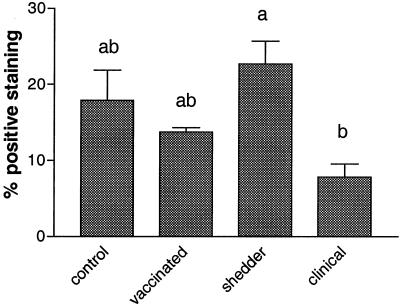
FIG. 2.
CD4+ αβ T-cell numbers in LPL in ileum sections as determined by FACS analysis. The frequency of CD4+ T cells (plus the SE) in LPL populations isolated from the ileum of cows from the control (n = 5), vaccinated (n = 5), shedder (n = 6), and clinical (n = 6) groups. Letters above columns indicate the results of statistical analysis. Columns that do not share letters are significantly different (P < 0.05).

