Figure 6.
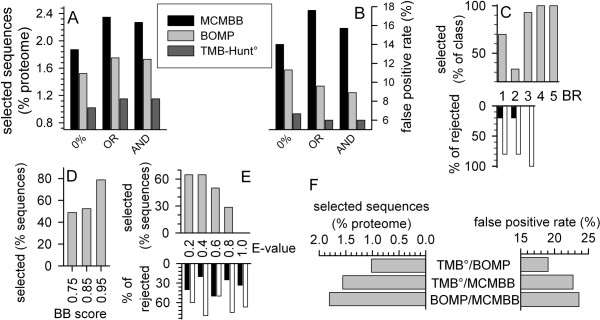
The performance of the combinatory approach. (A) The percentage of sequences selected from the E. coli proteome by our three methods in combination with MCMBB (black bar), BOMP (light grey bar) and TMB-Hunt, BBTM protein score >0 and E-value <1 (dark grey bar) is given. (B) The false positive rate for combinatory approach performed as under (A) is shown. (C) The percentage of sequences selected by BOMP and our AND selection were analyzed in comparison to the BOMP selection sorted according to the BOMP rank (BR) assigned (top panel, grey). The percentage of the (putative) outer membrane β-barrel proteins (black bar) and (putative) non-outer membrane β-barrel proteins (white bar) in relation to the total amount of rejected sequences is given on the bottom. (D, E) The percentage of sequences selected by TMB-Hunt° and our AND selection were analyzed in comparison to the TMB-Hunt° selection sorted according to the BB score (D) or E-value (E) assigned ({explained in [17]} grey). In (E), the percentage of the (putative) outer membrane β-barrel proteins (black bar) and (putative) non-outer membrane β-barrel proteins (white bar) in relation to the total amount of rejected sequences sorted according to the E-value is given on the bottom. (F) The percentage of the E. coli proteome selected by the combinatory approach between TMB-Hunt° & BOMP, TMB-Hunt° & MCMBB, and BOMP & MCMBB is given on the left side. The right side shows the false positive rate as explained in Fig. 5C.

