
Figure 1.
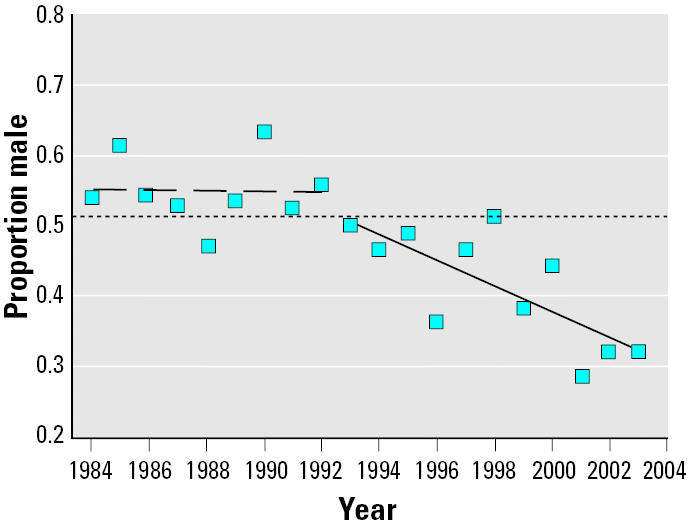
Proportion of live male births (male live births/total live births) for Aamjiwnaang First Nation 1984–2003. The dotted line is the expected male proportion for Canada (0.512). The dashed line is the linear regression line for the period 1984–1992; r2 = 0.000; slope not significantly different from zero (p = 0.990). The solid line is the linear regression line for the period 1993–2003; r2 = 0.547; statistically significant deviation of slope from zero (p = 0.009).