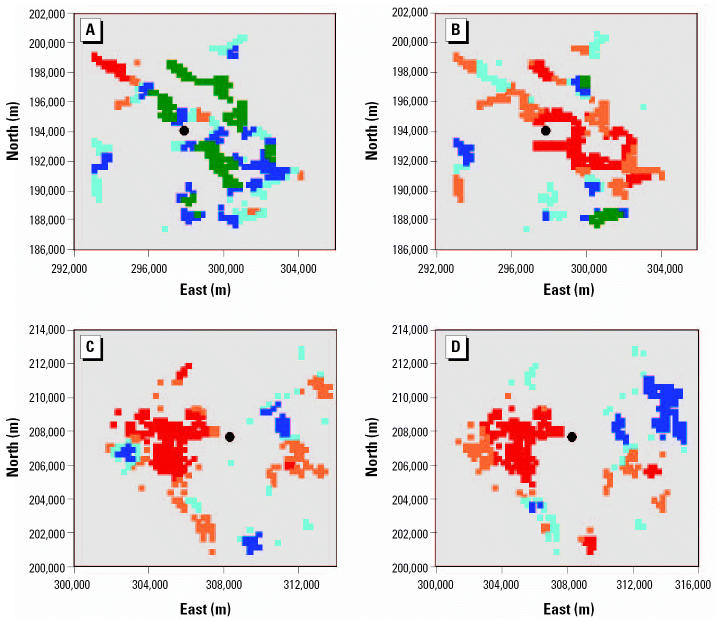
Figure 1.
Spatial distribution of smoothed standardized (observed–expected/expected) risk ratios for congenital anomalies within squares with 250-m sides in two areas. Colored squares are quintiles of the ratio observed–expected/square root of expected in descending order: red, orange, light blue, dark blue, green. (A) Nantygwyddon before opening; (B) Nantygwyddon after opening; (C) Trecatti before opening; (D) Trecatti after opening.

