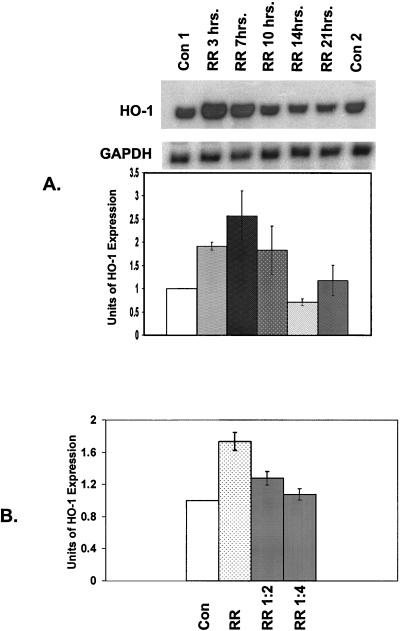
FIG. 2.
(A) Time course of changes in steady-state level of HO-1 mRNA in infected EC. Total RNA was extracted from cultures of EC harvested at different times after R. rickettsii (RR) infection. Uninfected EC were used as a control (Con) and processed with both early (Con1 at 7 h) and late (Con2 at 21 h) time points. A representative Northern blot obtained with HO-1 and GAPDH probes is shown. Band intensities were quantified as described in Materials and Methods. The values for HO-1 were normalized to those for GAPDH. The basal level of HO-1 expression in uninfected cells served as control for each experiment and was assigned a value of 1. Infected conditions were then compared to corresponding controls. Data in the graph is expressed as the mean (±SEM) of three independent experiments. (B) Dependence of R. rickettsii-induced HO-1 expression on the extent (PFU/cm2) of infection. EC were infected with 105 PFU of R. rickettsii organisms per cm2 of culture area (RR), along with RR diluted 1:2 (5 × 10⁴ PFU/cm2) and 1:4 (2.5 × 10⁴ PFU/cm2), followed by analysis of changes in HO-1 expression level.

