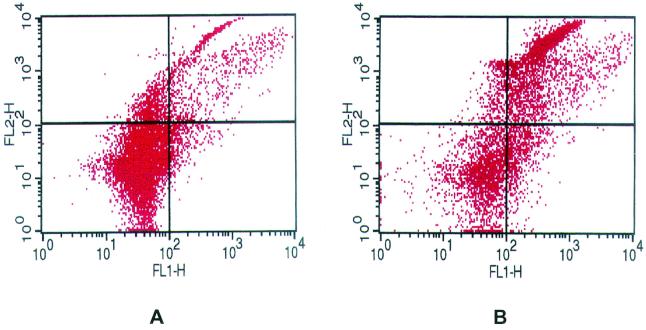
FIG. 2.
Two-color dot plot analysis of simultaneous phagocytosis and oxidative burst activity of untreated granulocytes (A) and granulocytes treated with 40 U of leukotoxin/ml (B). Lower left quadrant, cells negative for phagocytosis and ROI; upper left quadrant, cells with phagocytosed PI-labeled S. aureus, but negative for ROI; lower right quadrant, cells reactive for ROI but negative for phagocytosis; upper right quadrant, cells with simultaneous phagocytosis and ROI.

